IFAC World Congress 2023
Autonomous Point Cloud Segmentation for Power Lines Inspection in Smart Grid
- Robotics and Artificial Intelligence Group, Luleå University of Technology
Abstract
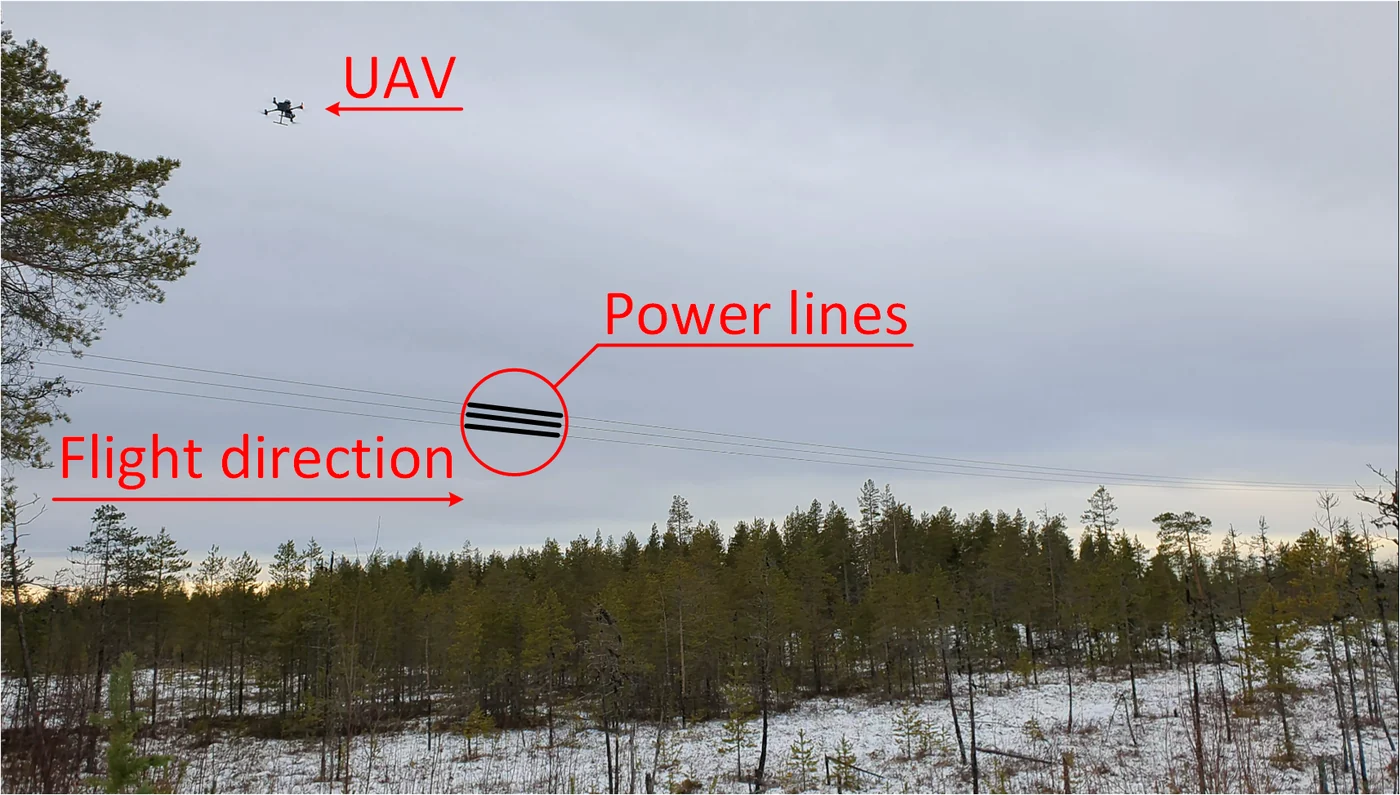
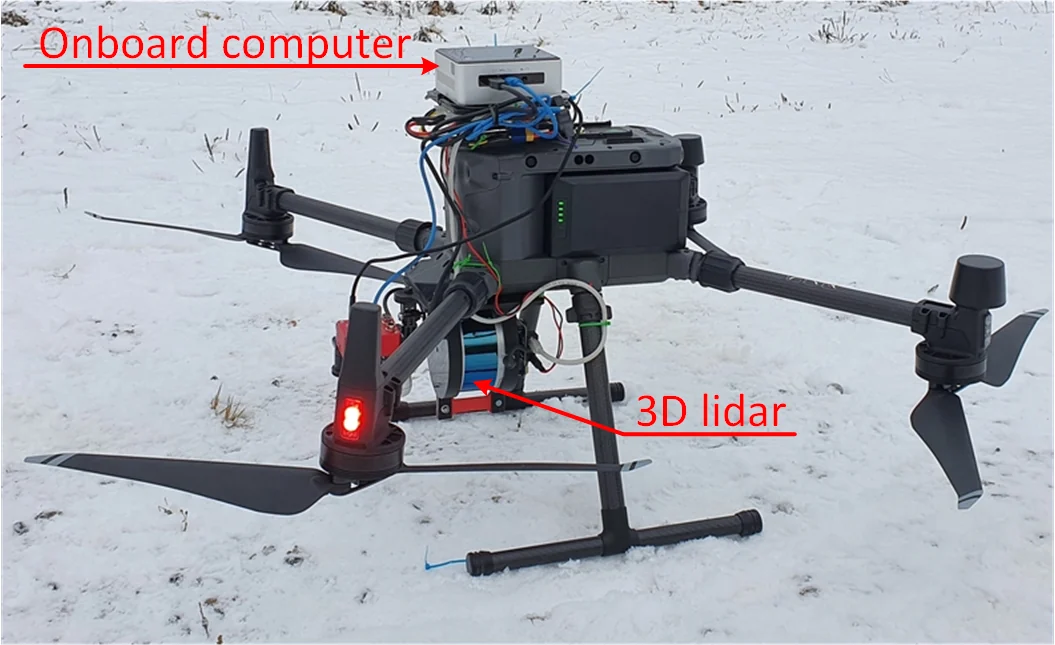
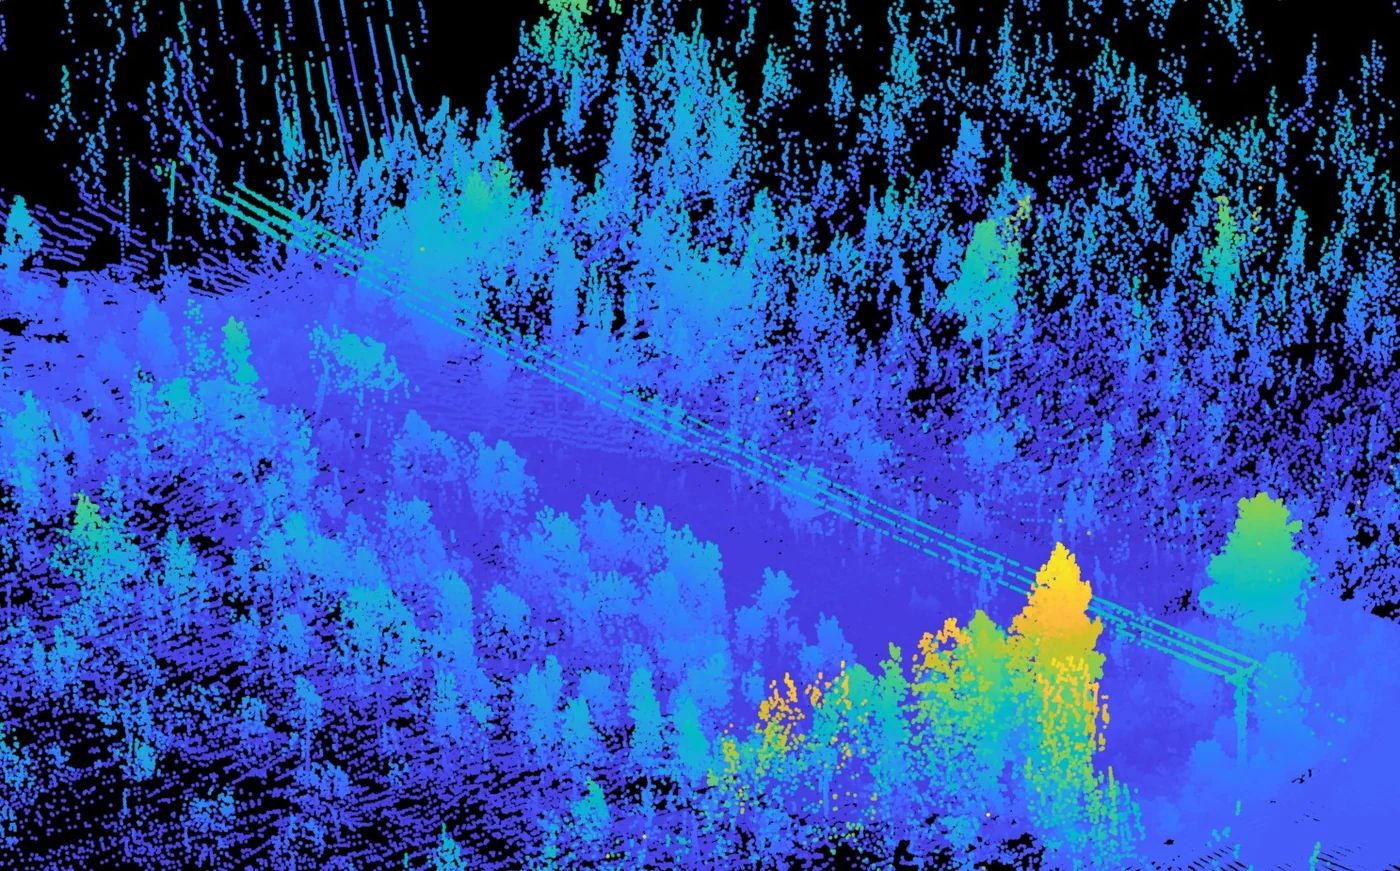
LiDAR is currently one of the most utilized sensors to effectively monitor the status of power lines and facilitate the inspection of remote power distribution networks and related infrastructures. To ensure the safe operation of the smart grid, various remote data acquisition strategies, such as Airborne Laser Scanning (ALS), Mobile Laser Scanning (MLS), and Terrestrial Laser Scanning (TSL) have been leveraged to allow continuous monitoring of regional power networks, which are typically surrounded by dense vegetation. In this article, an unsupervised Machine Learning (ML) framework is proposed, to detect, extract and analyze the characteristics of power lines of both high and low voltage, as well as the surrounding vegetation in a Power Line Corridor (PLC) solely from LiDAR data. Initially, the proposed approach eliminates the ground points from higher elevation points based on statistical analysis that applies density criteria and histogram thresholding. After denoising and transforming of the remaining candidate points by applying Principle Component Analysis (PCA) and Kd-tree, power line segmentation is achieved by utilizing a two-stage DBSCAN clustering to identify each power line individually. Finally, all high elevation points in the PLC are identified based on their distance to the newly segmented power lines. Conducted experiments illustrate that the proposed framework is an agnostic method that can efficiently detect the power lines and perform PLC-based hazard analysis.
Method
The pipeline needs no labels and no camera. It works on the LiDAR point cloud in four stages.
- Ground points are separated from higher points with density criteria and histogram thresholding.
- The remaining candidates are denoised and transformed with PCA and a kd-tree, which keeps the points that lie along lines.
- A two-stage DBSCAN clustering separates the individual conductors, and a catenary is fitted to each one.
- All high points in the corridor are then identified by their distance to the segmented lines, which is the basis for the hazard analysis.


Scroll the figure sideways, or tap it to open it full size.
Results
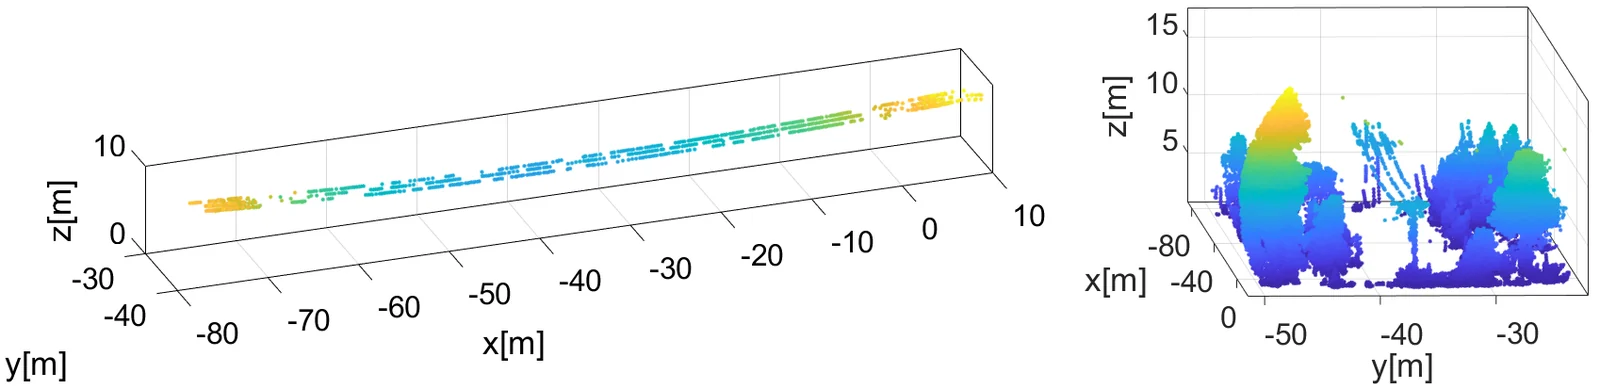
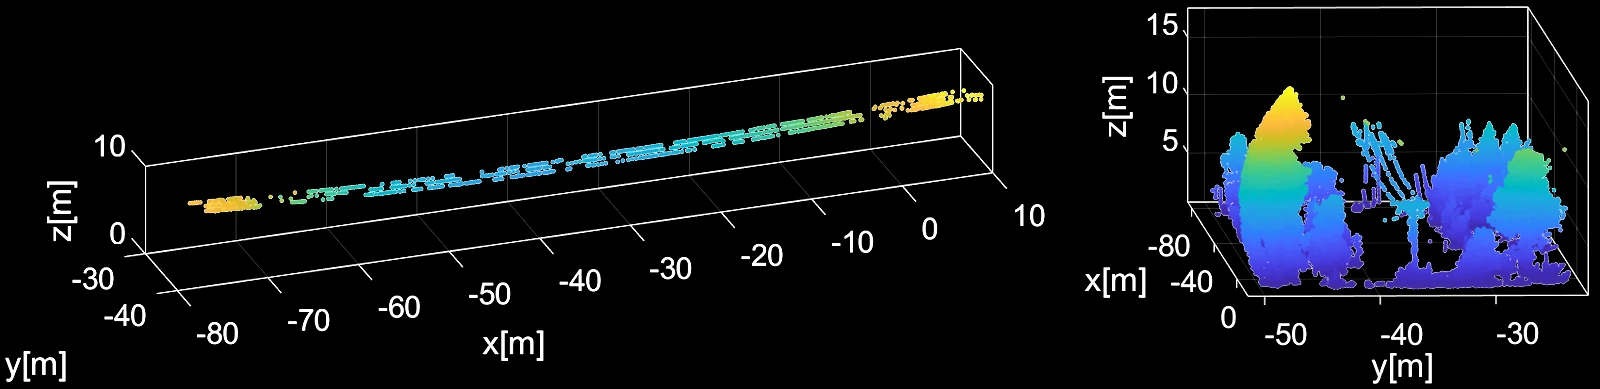
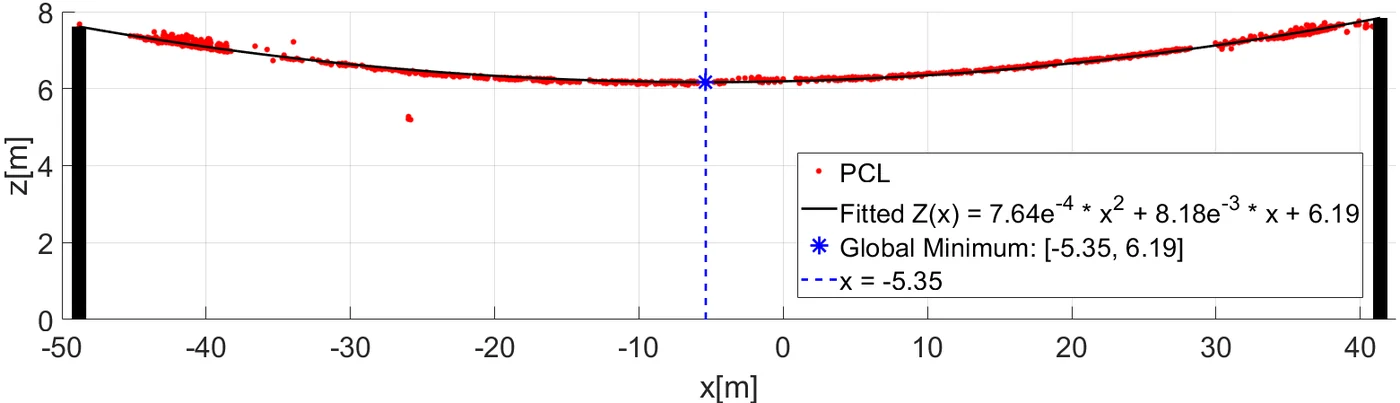
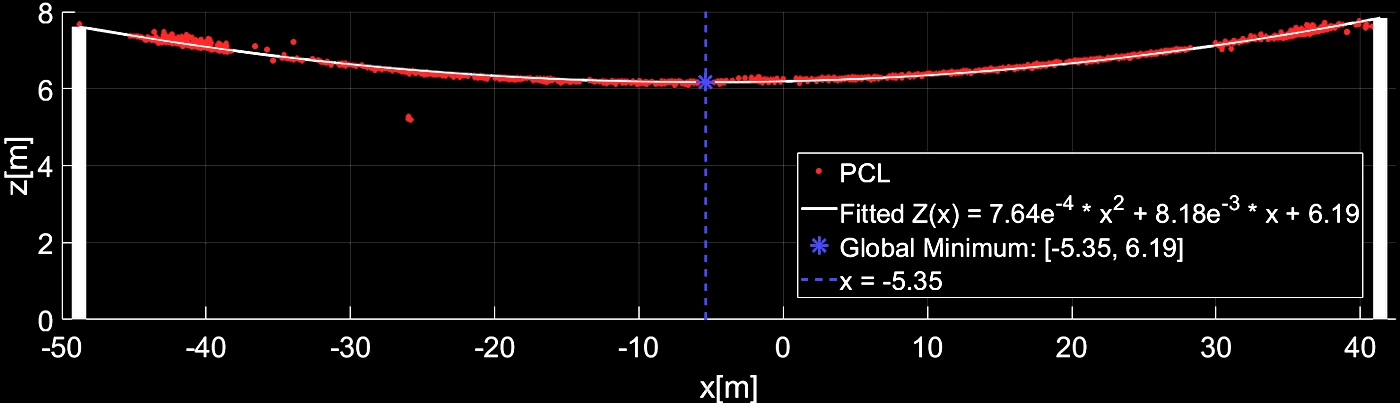
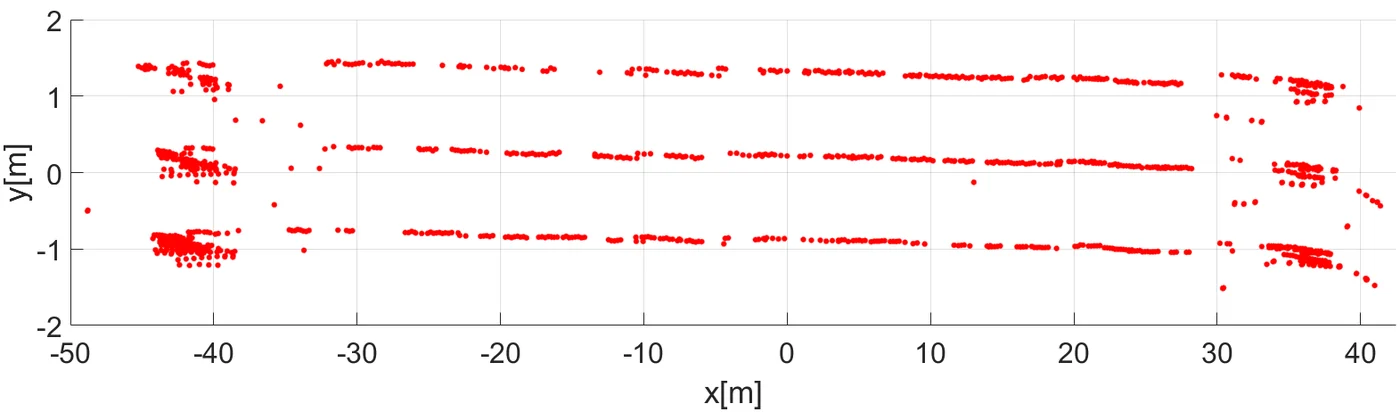
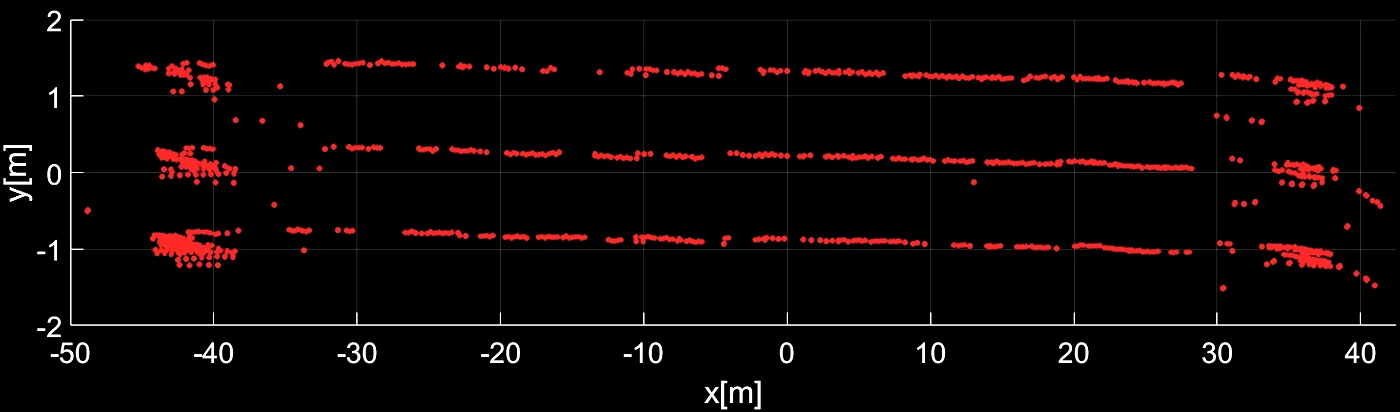


Extraction, segmentation and modeling of each conductor, used to assess its operational status.
Citation
@article{kyuroson2023powerlines,
  title   = {Autonomous Point Cloud Segmentation for Power Lines Inspection in Smart Grid},
  author  = {Kyuroson, Alexander and Koval, Anton and Nikolakopoulos, George},
  journal = {IFAC-PapersOnLine},
  volume  = {56},
  number  = {2},
  pages   = {11754--11761},
  year    = {2023},
  doi     = {10.1016/j.ifacol.2023.10.562}
}